Timeline
The timeline events
- Create a new event:
- double-click on the track and time you wish to add a new event.
- Rename the event label:
- double-click over the event.
- Resize the event:
- drag the left and right side of the box until you reach the desired size.
- Change the event color:
- right click over the event and choose the option “pick a color”.
- Lock the edition of an event:
- right click over the event and choose the option “lock”.
- Remove an event:
- right click over the event and choose the option “remove”.
Example: Creating, editing and deleting a note
Add and edit the properties of a row
With the mouse over a row, click on the right mouse button and choose the option “Row properties”. A new window will appear.
On this window you can set the label for the row and the color that the new events will have.
Example: Adding and editing rows
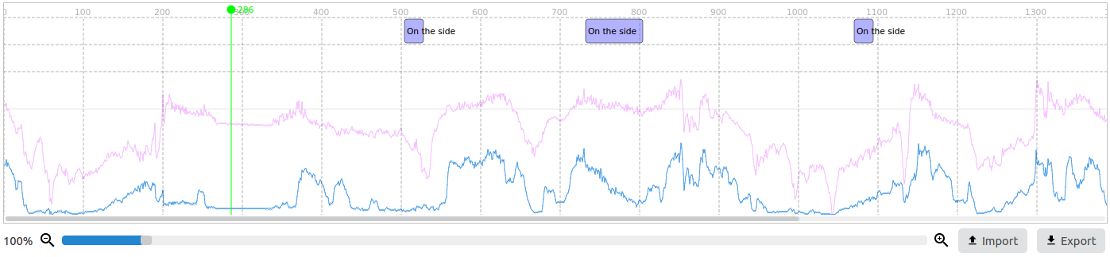
Show a dataset property on the timeline
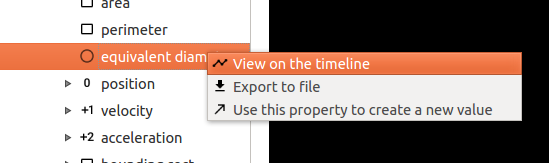
On the project’s tree select the dataset property you want to graph on the timeline, press the right button of the mouse and select the option “View on the timeline”. The graph of the property will then be shown on the timeline.
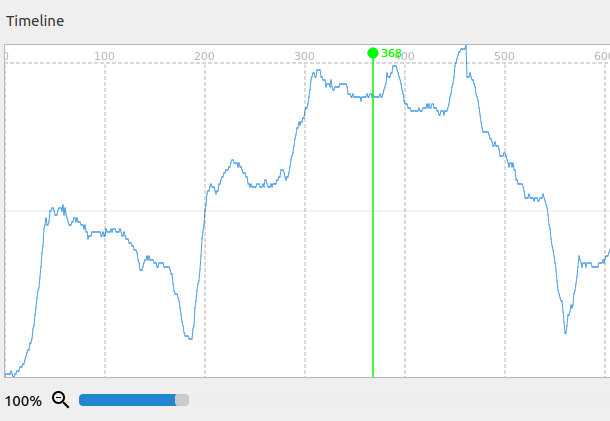
Result:
Import & export events
Use the buttons on the bottom right side to export events to a csv file or import graphs, events or bonsai events files.
Edit the graph’s properties
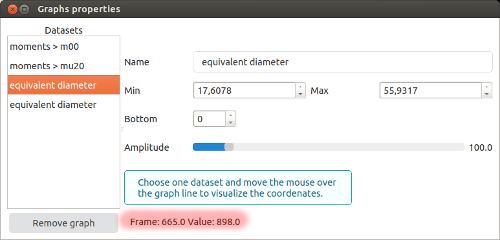
Press the right mouse button and select the “Graphs” option to access the graphs’ properties windows.
On this windows it’s possible to edit the graphs’ names and their displays.
Also, you can use this window to visualize the value of a graph at a certain point in time. Just select the graph and as you pass the mouse over the timeline, the value of the graph at a certain frame will be displayed on the window.
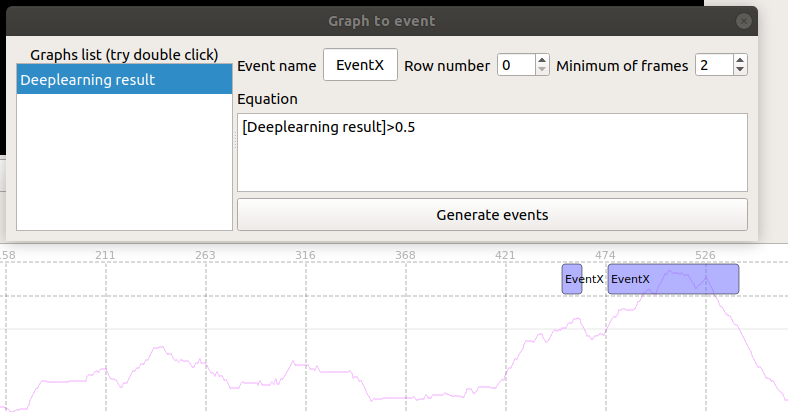
Convert graphs to events
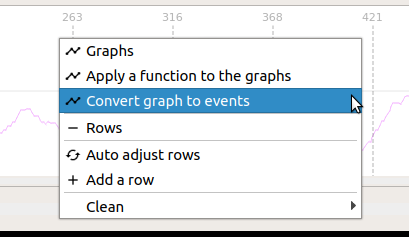
Right click the timeline and select the option “Convert graphs to events”.
A new window will be shown. On the left-side list, double click on the graph you would like to use for the equation, and write the rest of it.
Use the fields Event name to define the name of the new events, use the row number field to define the row where the events should be created, and the Minimum number of frames to define the necessary number of consecutive frames where the equation is verified to create the events.
Equation example:
[Deeplearning result]>0.5 and [value(6)]<10
Note
Use spaces only between logic operators: and or or.
1. Right click the timeline and choose the option “Convert graphs to events”
2. Write the equation
3. Choose the name for the events, the minimum number of frames and the row they will be displayed in